Guidelines for using multiple imputation without bias in studies
Theme Translational data science
Workstream Large, complex datasets
Status: This project is complete
In health research, it’s common to have missing information in study data, especially in large studies that look at risk factors for disease. This missing data can make it hard to get accurate results.
Researchers often deal with this problem using methods like complete records analysis (CRA), where they only use participants with full data, or multiple imputation (MI), where they fill in missing values using statistical techniques.
While MI can give reliable results under certain conditions, it’s not always easy to tell if these conditions are met, especially when many pieces of data are missing.
Understanding whether these methods produce biased (misleading) results is important when studying how different exposures, such as smoking, affect health outcomes.
What we did
This project aimed to help researchers decide whether MI will result in misleading estimates of the relationship between an exposure and an outcome.
We:
- Developed an easy-to-use tool that shows whether MI can be used without bias in a full dataset
- Used directed acyclic graphs to visualise the results
- Offered an alternative approach via minor modifications to the tool, if it determines that MI in the full dataset is not valid
- Applied the tool to a real-world example looking at maternal smoking and children’s IQ using data from Children of the 90s. This helped us understand how to make better decisions about the use of MI in a realistic research scenario
- Tested it with researchers, which helped us fine tune it. For example, we made changes to the directed acyclic graph to address colour blindness
- Published clear guidance for researchers on how to use the tool
What this means
Our tool can be applied in a wide range of scientific fields. Ultimately, this work will improve the quality and reliability of research findings about the risk factors of disease.
Find out more
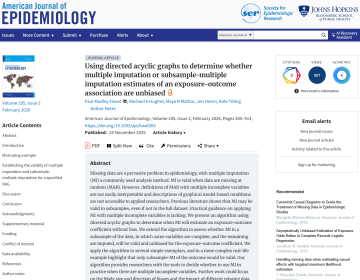
Using directed acyclic graphs to determine whether multiple imputation or subsample-multiple imputation estimates of an exposure-outcome association are unbiased